
Around half of all marriages end in divorce in the United States, but that statistic can be misleading. While the statement is eye-catching, we cannot draw conclusions based on generalization.
For example, in 2019, divorce rates reached their lowest in the last 50 years, with 7.6 divorces per 1,000 marriages across all states. The statement also doesn’t consider second or third marriages or divorces separately, which can skew the numbers.
As a result, divorce statistics aren’t one-size-fits-all measurements, and a deeper look into demographics, age groups, the economy, and other influences is needed to identify and understand the intricacies of Marriages and Divorces in the U.S..
For this reason, we set out to determine the realities of marriages and divorces in the U.S. to further produce one-year estimates for U.S. marital status across three years: 2011, 2016, and 2021.
Key Findings on Marriages and Divorces in the U.S.
- Overall, divorce rates per 1,000 have declined from 2001 to today, with a slight uptick beginning in 2021 that correlates with a similar decrease and uptick in marriage rates during the same period.
- The overall divorce-to-marriage ratio has decreased over time, fluctuating yearly.
- Not all states follow the same patterns. Massachusetts saw a decrease in divorce rates until 2004; they increased briefly before experiencing a sudden drop in 2011.
- Oklahoma reported no data from 2000 to 2003. It had a relatively high divorce rate that slowly decreased through 2019. It increased slightly and then dropped before increasing slightly again.
- The District of Columbia is an outlier. It has seen an increase in divorce rates, unlike other locations in the USA.
- There was a steady decrease in divorce rates across all states leading up to the years of the pandemic. During that time, divorce and marriage rates dropped but increased as the nation returned to its normal operations.
- Marriage rates are falling in most states, but 2021 saw an uptick as the nation reopened following COVID-19.
- Montana has seen a great increase in marriage rates over time, with 11 marriages per 1,000 people in the population.
- Marriage rates have fallen in the U.S. over time, starting at 8.2 marriages per 1,000 in 2000 and falling to only 5.1 marriages per 1,000 by 2020. In 2021, an uptick in marriages led to the rate increasing to 6 marriages per 1,000.
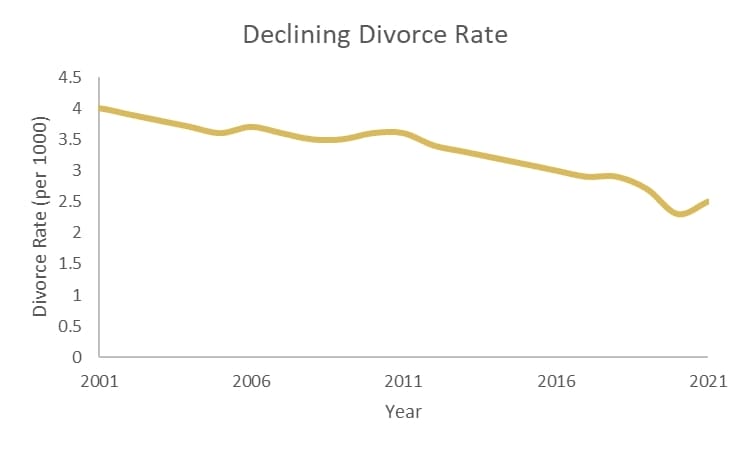
- Divorce rates have also fallen over time in the United States, going from a peak of 4 per 1,000 people in the population in 2000 to only 2.3 per 1,000 by 2020. However, 2021 saw an increase in divorce rates, increasing the annual rate to 2.5 per 1,000.
34.2% Americans Remain Unmarried at Present-day: Is Marriage Losing its Importance?
Today, 48% of the United States adult population is married, and only 10.6% is divorced. A small subsect of the population is separated (1.7%), and 34.2% have never married. 5.5% of marriages ended with death, leaving either the husband or wife a widower.
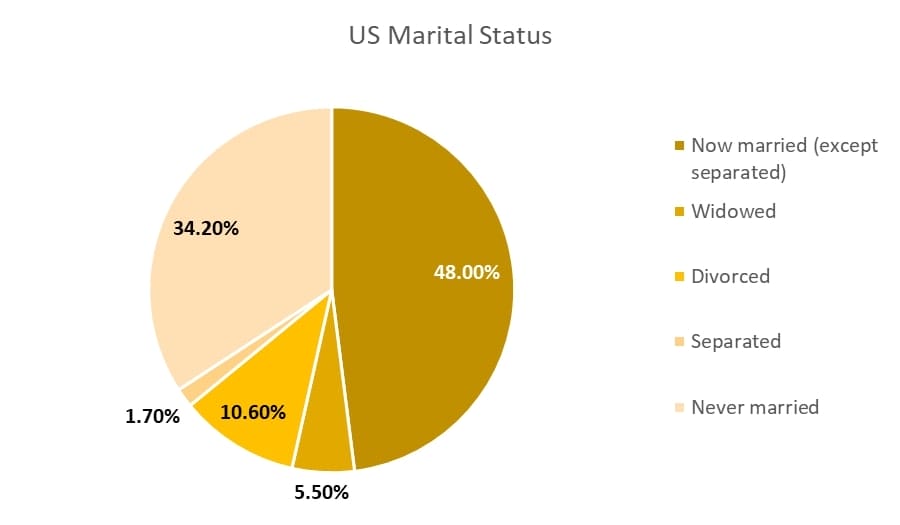
This statistic is important to remember because it shows that there is still a major push toward marriage – however, marriage is likely in less than half the overall population. In a general sense, we can assume that the general population is just as likely to get married as it is to stay unmarried or divorced — marriage is not necessarily a necessity for everyone.
By comparing the marriage rates in 2001 to those in 2021, you’ll find that marriage rates in most U.S. states have been decreasing over time. There could be several reasons, such as changes in the once-taboo nature of remaining single and the introduction of women in higher-paying roles in the labor force.
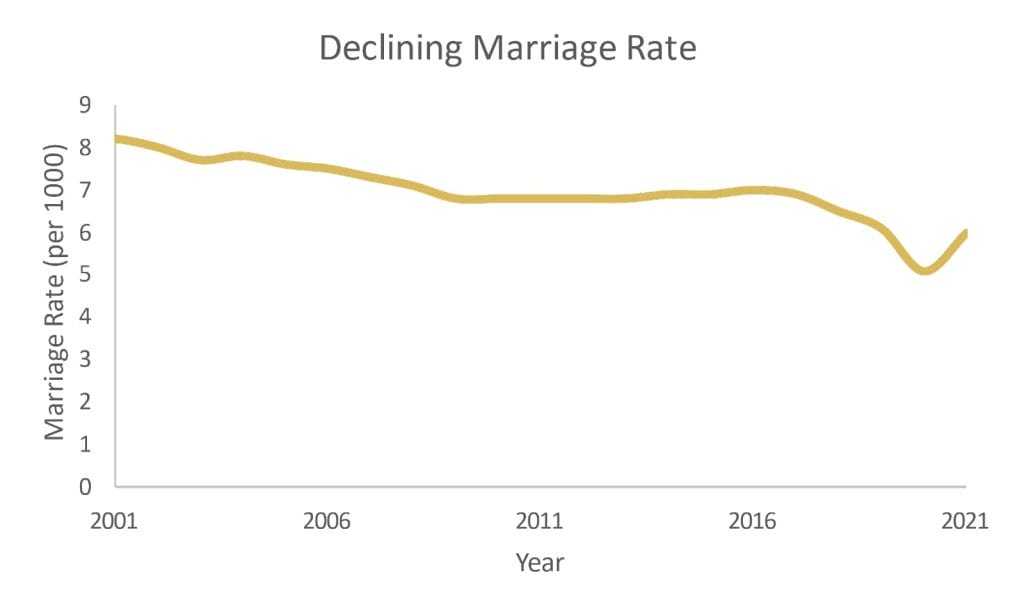
The data makes it easy to agree that marriage rates are declining. One discrepancy in that statement, though, is with the sudden uptick of marriages per 1,000 that occurred near the end of the COVID-19 pandemic between 2020 and 2021. A sudden surge happened then, but it still did not bring the number of marriages up above previous years, such as in 2001 when the rate was approximately 8.2 marriages per 1,000 people.
2000 and 2001 were the last years in which the marriage rate was 8.2 per 1,000 — since then, the rate has decreased each year with only a minor recovery in 2004 (7.8 up from 7.7), 2014 (6.9 up from 6.8) and 2021 (6 up from 5.1). It will take additional data to see if marriages will decline again following this minor increase or if an increase will continue based on economic or other related factors.
Divorce Rates in the U.S.
Divorce rates in the U.S. have decreased — but that’s not the whole story. While the number of divorces per 1,000 has decreased annually overall, there was a significant drop in divorces from 2018 to 2019, which saw an uptick by 2021. This can be attributed to economic changes and the national shutdown due to COVID-19.
Not all states share their divorce statistics, but in the 45 U.S. states that did share, there were 689,308 divorces in 2021. That’s in comparison to 1,985,072 marriages the same year.
Looking at divorce and marriage rates, it is safe to say that they are correlated. The decrease in divorces could be linked to the decrease in marriages, just as a sudden increase in marriages can sometimes prophesize an increase in divorces simultaneously. However, in the case of 2019 through 2021, the COVID-19 pandemic’s stay-at-home order played a role in the ability to marry or divorce, which has influenced this dataset.
Divorce Rate Trends By State
Divorce rates for all states decreased over time between 2000 and 2021, other than in North Dakota.
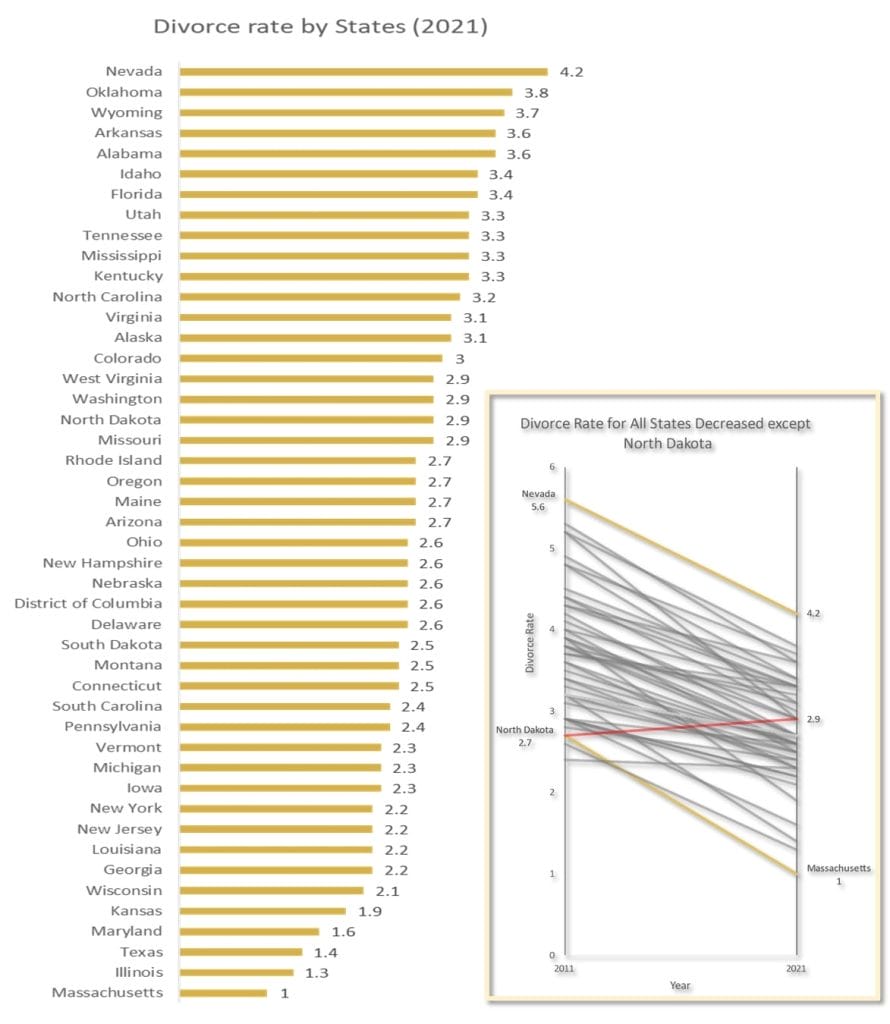
In North Dakota, there was a small increase from 2.7 divorces per 1,000 to 2.9 divorces per 1,000. Other notable data include Massachusetts having the lowest divorce rate of all states at one divorce per 1,000, while Nevada sees the highest divorce rate of 4.2 divorces per 1,000.
U.S. Marriage and Divorce Trends by Gender and Age
It’s also important to remember that various factors influence the divorce rate in America. Men and women are rarely marrying or divorcing at the same rates. The primary indicators anchoring marriage and divorce trends in the U.S. are gender and age.
Marriage More Popular in Men after 45, and Women Until 45?
In youth, those between 15 and 19 are on the same page, though, with only 1% of men getting married and 1.1% of women getting married.
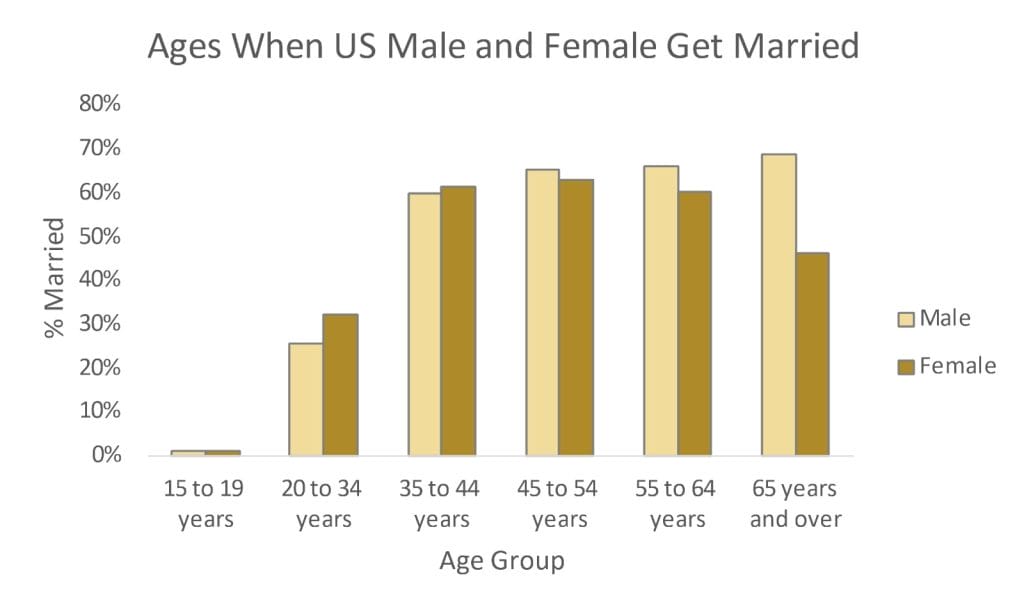
Between 20 and 34 years old, 32.3% of females get married, while the number is lower for men at 25.4%. This imbalance continues until 45 to 54, when marriage rates are higher for men at 65.3%, overtaking 62.9% of women.
Divorce is More Popular in Women Compared To Men
Female marriages continue to drop across all ages from 20 to 65, while male unions increase.
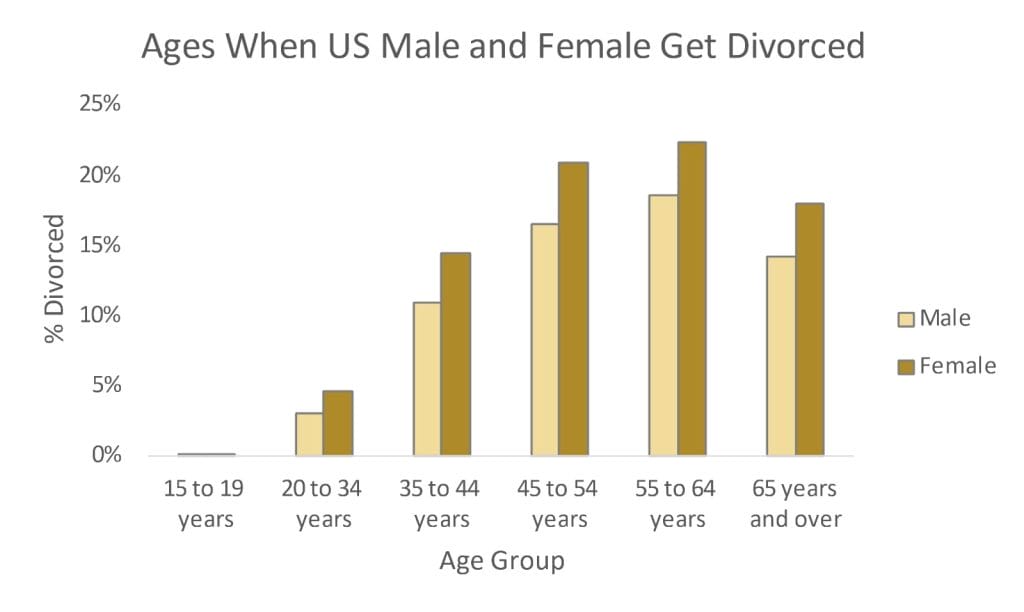
The data shows that men marry more often as they get older. Women, however, get married earlier but divorce sooner than men, which is evidenced by the fact that over 68.7% of men are married at 65 or older while under 50% of women are married at the same age.
Additionally, under 14.2% of men are divorced at 65 or older, while over 17.9% of women are divorced.
Connecting the Dots For Marital Desire: What Changed?
Another interesting fact is how behavior has changed over time in terms of marriage and divorce rates by age.
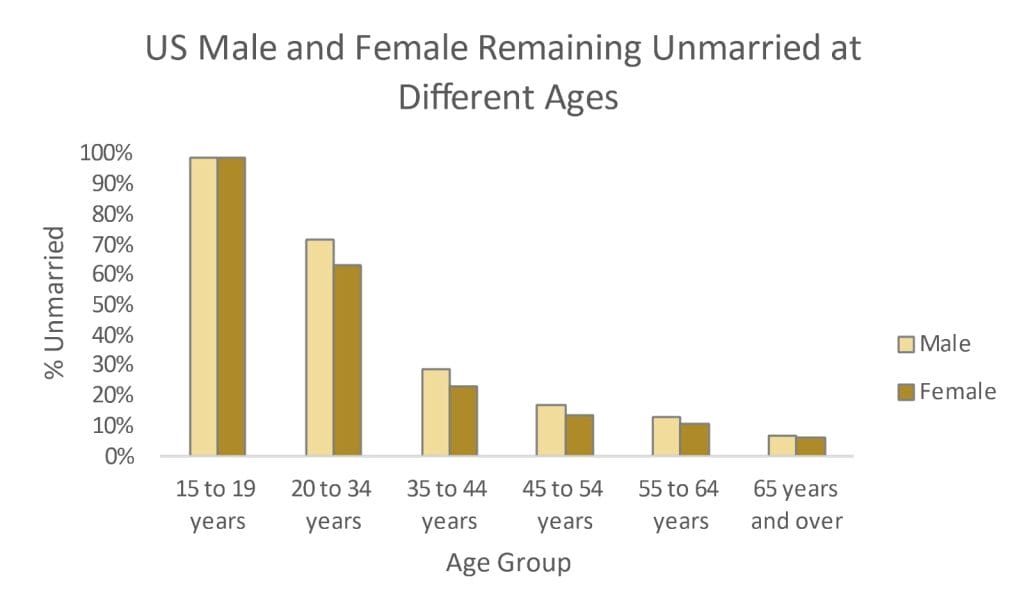
The “Never Married” population in men has increased across all age groups between 2011 and 2021. In the 20 to 34 age group, this is most pronounced — 67% of men had never been married in 2011, but in 2021, that increased to 72% of men. The same phenomenon happened for women — 57% of those between 20 to 34 were “Never Married” in 2011 but 63% were “Never Married” in 2021.
This points to a change in behavior among Americans — men and women are less likely to get married at an early age (under 34) in 2021 and beyond compared to 10 years previously.
Racial Differences In Marriage and Divorce Rates
Another factor to remember is race. Patterns in race do play a role in when people marry and which races are most likely to marry. The data has found that Asian Americans are most likely to be married and the least likely to be divorced.
Does Cultural Difference Among Asian Americans Define High Marriage and Low Divorce Rates?
This may be attributed to Eastern cultural traits. 58% of Asian Americans are married, 7% are divorced, and only 31% never marry.
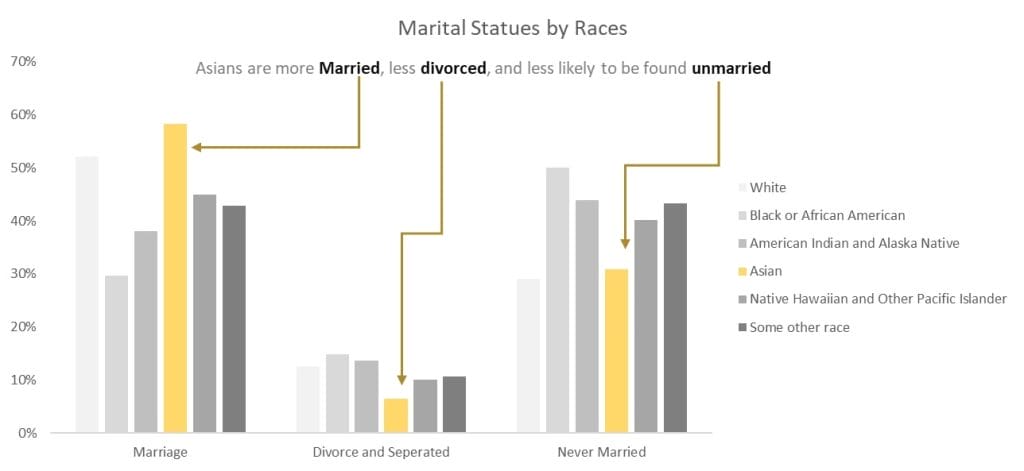
This is an interesting fact when compared to other races. For example, 52% of Caucasians (whites) are married, but 13% are divorced. 29% never marry. For Black or African Americans, 30% of the population is married, 15% is divorced, and half never marry.
For American Indians and Alaska Natives, 38% are married, while 14% are divorced, and 44% have never been married. Native Hawaiians and Pacific Islanders report that 45% of people marry, while 10% divorce. 40% of this group has never married.
Work Influences on Divorce Rates
There could be another influence on divorce rates — working. The divorce rate for females working in the labor force is higher than for males.
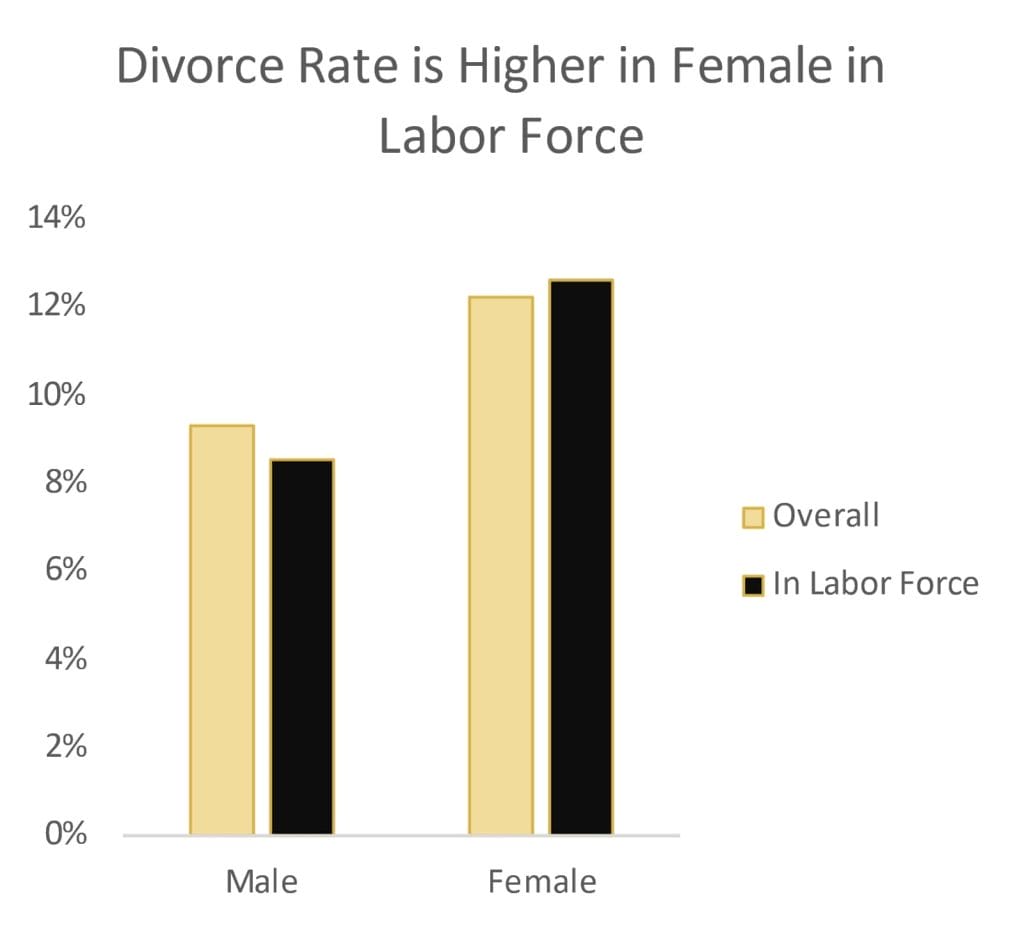
Overall, 9.3% of men get divorced, and 8.5% are in the labor force. Comparatively, 12.2% of females get divorced, but 12.6% are a part of the labor force.
This shows that females in the labor force get divorced more often, but why could that be? One reason may be that they have access to the funds needed to support themselves and get a divorce when it’s needed, a factor that could hold back females who are not a part of the labor force.
Methodology
To identify a clear correlation between marriage and divorce rates, through indicators like gender and age differences, racial and cultural differences, and work influence, our study recognized who is more likely to marry or divorce than someone else and when those marriages or divorces may occur.
A rigorous methodology was employed to thoroughly understand marital trends in the United States. Using two datasets taken from the Center for Disease Control and Prevention (CDC), “National Marriage and Divorce Rate Trends for 2000-2021” and “Divorce Rates by State: 1990, 1995, and 1999-2021,” we established a new ratio between marriage and divorce rates to show the real change over the last several years.
The methodology encompassed the following steps:
- CDCP Datasets:
- Two primary datasets were acquired from the CDCP, covering the period 2000 to 2021 for national marriage and divorce rate trends, and divorce rates by State for 1990, 1995, and 1999 to 2021.
- A unique variable from the first dataset reflects the marriage-to-divorce rate ratio. This innovative metric offered deeper insights into actual changes in divorce rates.
- American Community Survey Data:
- The United States Census Bureau provided pivotal data from the 1-Year Estimates of “U.S. Marital Status” for 2021, 2016, and 2011.
- Meticulous consolidation of these data points facilitated the identification of enduring trends in marriage and divorce rates.
This straightforward methodology enabled a comprehensive analysis of marital dynamics across various demographic dimensions and time spans by seamlessly integrating datasets from authoritative sources. This robust approach paved the way for meaningful conclusions and informed predictions regarding marital and divorce trends in the United States.
MEET WITH AN ILLINOIS FAMILY LAW ATTORNEY TODAY
The Family Law attorneys at Koth Gregory & Nieminski understand that your family is the top priority, which is why we offer SAME-DAY APPOINTMENTS. If you need a divorce or other family law services, you can schedule your first meeting through our online appointment calendar. We look forward to meeting you.
Disclaimer: This article (Present-Day Scenario of Marriages and Divorces in the U.S.) may contain information that is outdated as Illinois law continuously evolves. Meeting with an experienced family law attorney is the best way to ensure you are receiving the most current information about Present-Day Scenario of Marriages and Divorces in the U.S.